

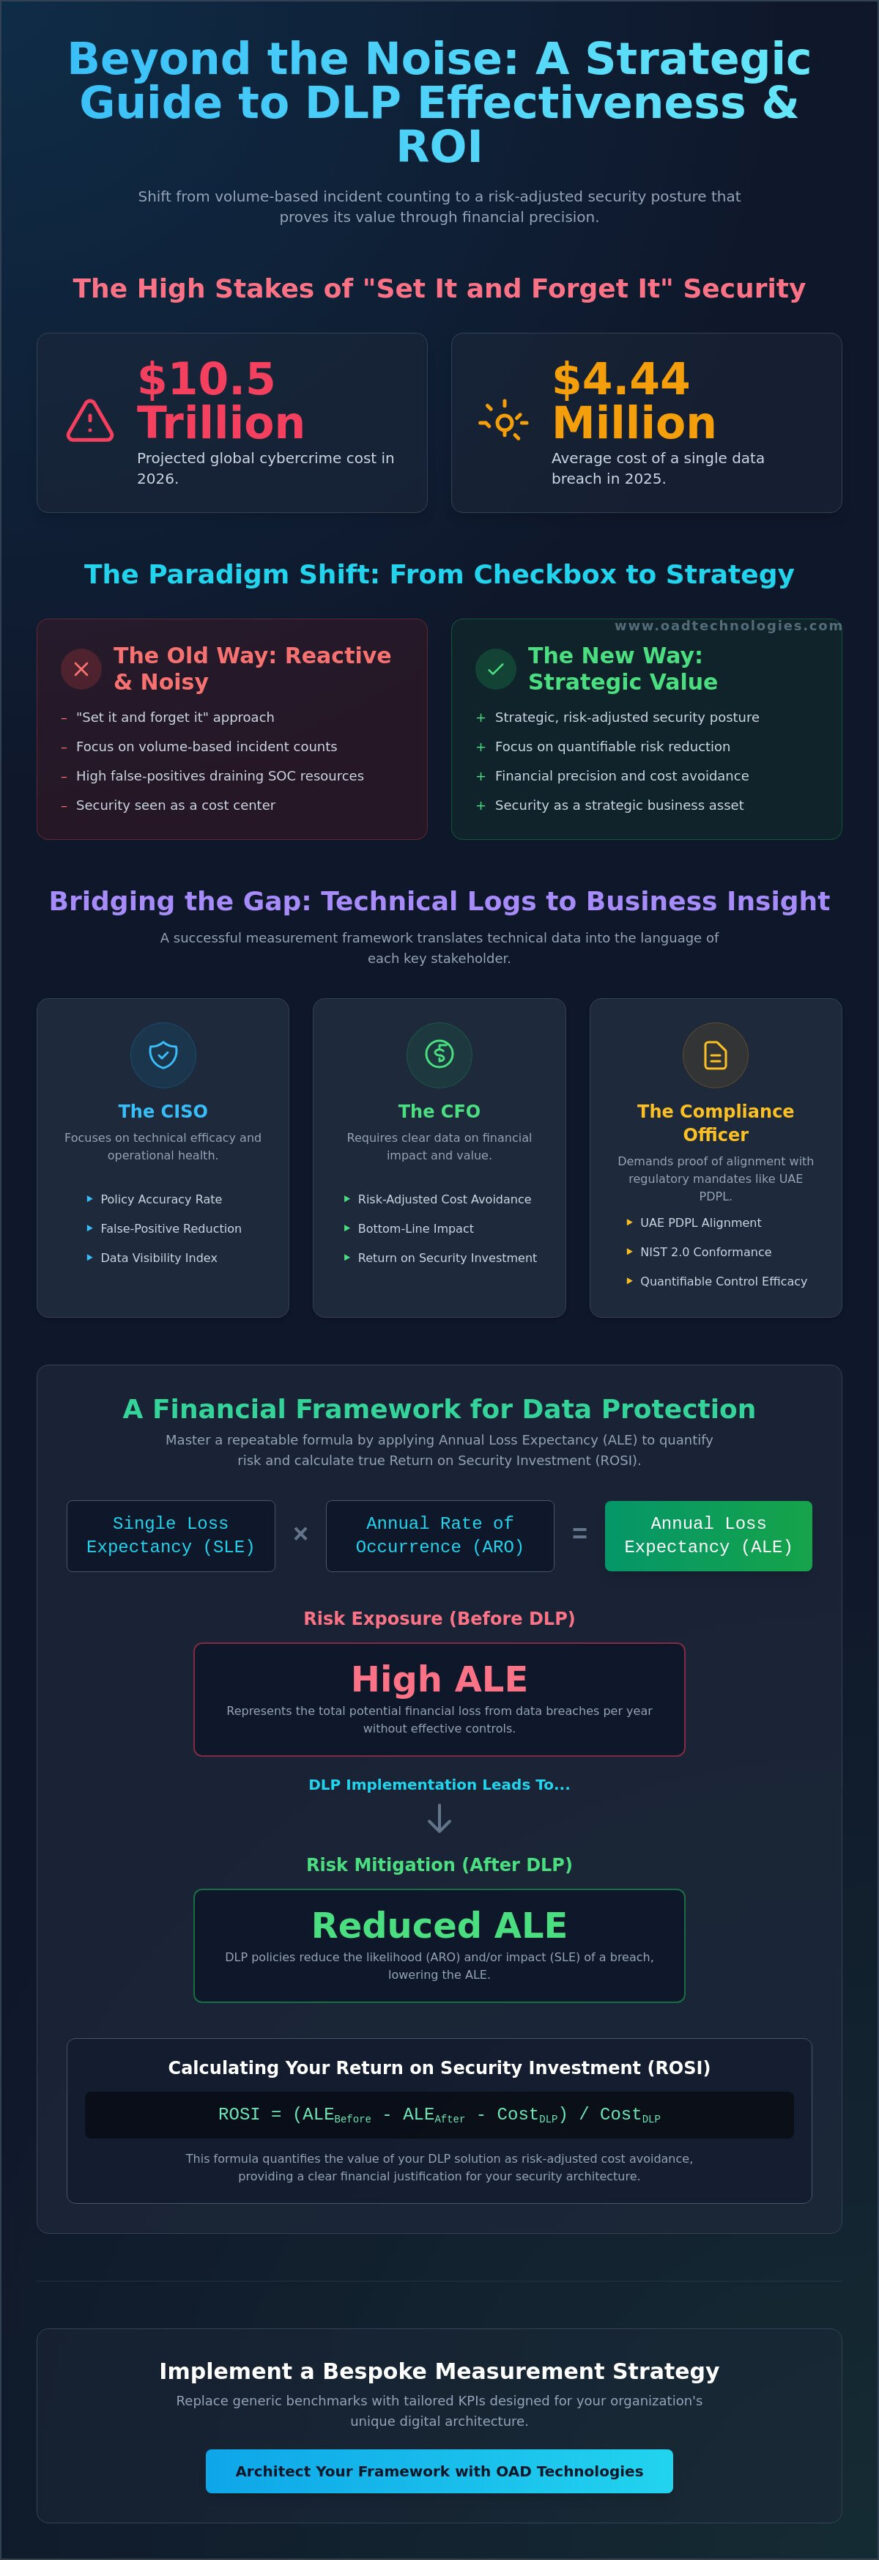
With global cybercrime costs projected to hit $10.5 trillion in 2026, a “set it and forget it” approach to data security is no longer a viable strategy for UAE enterprises. You likely feel the mounting pressure to master measuring dlp effectiveness and roi, especially as the average cost of a data breach reached $4.44 million in 2025. It’s exhausting to manage high false-positive rates that drain SOC resources while trying to demonstrate that your security architecture is actually protecting the bottom line.
We believe that security leaders deserve a seat at the table, but that seat is earned through financial precision. This guide will help you quantify your data protection value by providing a repeatable formula for calculating return on security investment and a clear set of KPIs tailored for the UAE PDPL landscape. You’ll learn how to move beyond simple incident counts to quantify risk-adjusted cost avoidance; this ensures your data protection strategy is both a technical success and a strategic business asset for the long term.
Key Takeaways
- Shift your perspective from volume-based incident counting to a strategic, risk-adjusted security posture to move beyond simple checkbox compliance.
- Utilize technical metrics like the Data Visibility Index and Policy Accuracy Rate to maintain a precise balance between data classification and SOC resource management.
- Master a repeatable financial framework for measuring dlp effectiveness and roi by applying the Annual Loss Expectancy (ALE) formula to quantify the value of risk mitigation.
- Unlock operational synergies by reducing your security noise floor and automating complex Governance Risk and Compliance (GRC) reporting for UAE PDPL requirements.
- Implement a bespoke measurement strategy that replaces generic industry benchmarks with tailored KPIs designed for your organization’s unique digital architecture.
The Strategic Necessity of Measuring DLP Effectiveness in 2026
By 2026, the era of “checkbox compliance” has officially ended. Organizations can’t simply deploy Data Loss Prevention (DLP) software and assume they’re secure because a dashboard shows a high number of blocked events. Real security maturity requires a shift toward strategic, value-driven protection. This transformation centers on measuring dlp effectiveness and roi to ensure that every security investment contributes to long-term digital relevance. As an Expert Architect, OAD Technologies bridges the gap between raw incident logs and the high-level logic required for board-level decision-making.
The Gap Between Technical Logs and Business Insight
Raw technical logs often obscure the truth. If a system records 1,000 blocked incidents in a single week, a technical lead might see success. However, an architect sees a potential failure in policy tuning. These high numbers often signify that your SOC resources are being drained by noise rather than real threats. Translating raw data into strategic growth requires a nuanced understanding of stakeholders. We must move beyond “incident counting” to reflect a true security posture that empowers people rather than just stopping processes. Defining the needs of different stakeholders is critical for a successful measurement framework:
- The CISO: Focuses on policy accuracy, the reduction of false-positive rates, and the Data Visibility Index.
- The CFO: Requires clear data on risk-adjusted cost avoidance and the impact on the bottom line.
- The Compliance Officer: Demands proof of alignment with UAE PDPL and international standards like NIST 2.0.
The CFO demands a repeatable formula that justifies the budget against the $10.22 million average breach cost seen in high-risk markets or the rising costs in the UAE. Without this translation layer, technical logs remain an expense rather than an asset.
Regulatory Pressures and National Compliance Standards
The UAE Personal Data Protection Law (PDPL) imposes strict mandates on data residency and processing that require more than just a “good enough” approach. Effective measurement simplifies your vulnerability assessment and penetration testing results by providing quantifiable evidence of control efficacy. In the UAE market, the cost of non-compliance isn’t just about legal penalties. It’s about the massive remediation expenses and lost brand equity that follow a public leak. With global cybercrime costs hitting $10.5 trillion in 2026, the ability to prove compliance through technical authority is a competitive advantage. Mastering the art of measuring dlp effectiveness and roi allows you to validate your security architecture against national mandates while maintaining operational momentum. We don’t believe in one-size-fits-all metrics. We focus on bespoke KPIs that align with the specific digital challenges of the Emirates.
Core Metrics: Quantifying Performance Through Technical Authority
Technical authority in data protection isn’t achieved through broad strokes; it’s built on the precision of your telemetry. By 2026, the complexity of hybrid cloud environments has made measuring dlp effectiveness and roi a matter of granular data points rather than general assumptions. We move beyond the “if” of protection to the “how well” by focusing on metrics that reflect actual risk reduction. This requires a balanced look at the Data Visibility Index and Policy Accuracy Rate to ensure your security posture remains both robust and agile. If you’re looking to refine these metrics for your specific environment, our team at OAD Technologies can help architect a bespoke framework.
Data Visibility and Discovery Accuracy
You can’t protect what you haven’t identified. The effectiveness of automated classification has become the primary differentiator for modern enterprises. While manual tagging often leads to a backlog of unmanaged information, automated semantic analysis identifies sensitive data without relying on rigid, outdated rules. We track the “Dark Data” metric to measure the volume of unmanaged sensitive information residing in forgotten silos. The Data Discovery Success Rate is defined as the percentage of corporate assets successfully identified, classified, and mapped against existing protection policies, serving as a primary KPI for 2026. This metric ensures that your visibility keeps pace with the 26.9% CAGR of the DLP market, preventing blind spots that lead to expensive breaches.
Incident Response and Remediation Speed
Data protection value is directly tied to how quickly an organization can neutralize a threat. On average, it takes organizations 277 days to identify and contain a security incident. Reducing this “dwell time” is a critical component of measuring dlp effectiveness and roi. When your DLP feeds directly into managed detection and response (MDR) workflows, the transition from detection to remediation becomes seamless. We measure the efficiency of automated policy enforcement against manual intervention to quantify the hours saved for your SOC team. High false-positive rates are more than just an annoyance; they’re a financial drain. A high Policy Accuracy Rate ensures that your team spends time on true exfiltration attempts rather than chasing ghosts in the machine.
Finally, we must quantify the “human element” through User Risk Scoring. This metric moves away from blaming individuals and toward empowering them. By tracking behavioral anomalies and policy violations at the user level, we can identify high-risk patterns before they result in a $4.44 million data breach. This allows for targeted training and bespoke policy adjustments that protect the organization while maintaining the steady, deliberate rhythm of your daily operations. A well-managed DLP lifecycle doesn’t just stop data; it optimizes the intersection of human intelligence and machine capability.
Calculating ROI: A Financial Framework for Data Protection
Security leaders often struggle to justify budgets because they lack a structured financial framework. By 2026, the complexity of the global threat landscape demands a more rigorous approach than “best effort” protection. To succeed in measuring dlp effectiveness and roi, you must move beyond technical logs and speak the language of the CFO. This involves re-framing DLP as a strategic insurance premium that safeguards your long-term digital relevance. By calculating the cost of “no action” against the price of proactive defense, you transform security from a line-item expense into a strategic growth driver.
Quantifying Risk Reduction (ALE vs. ALEm)
The foundation of any financial security model is the Annual Loss Expectancy (ALE) formula. To calculate your baseline risk, multiply the Single Loss Expectancy (SLE), which is the total cost of one data breach, by the Annualized Rate of Occurrence (ARO). In 2025, the global average cost of a breach was $4.44 million, but for financial services, that number jumped to $6.08 million. Once you implement a bespoke DLP solution, you calculate the ALEm (mitigated), which accounts for the risk reduction percentage achieved through technical controls. ALE provides a baseline for cybersecurity ROI by translating technical vulnerabilities into a concrete dollar value representing potential annual business loss. The delta between your ALE and ALEm, minus the solution’s cost, reveals your true Return on Security Investment (ROSI).
Protecting Brand Equity and Intangible Assets
While regulatory fines are easy to track, the erosion of brand equity is often the most significant long-term cost. When a breach occurs, customer churn can increase by 3% to 5% almost immediately. In the competitive UAE enterprise landscape, customer trust is a primary currency for strategic growth. Measuring dlp effectiveness and roi must therefore include the valuation of intangible assets, such as proprietary trade secrets and intellectual property. Protecting these assets ensures market competitiveness and prevents the competitive disadvantage that occurs when external entities gain access to your internal roadmaps. By future-proofing your data today, you’re not just avoiding a $10.22 million US-style breach penalty; you’re securing your organization’s reputation in an era where data privacy is a non-negotiable consumer expectation.
Cost avoidance also extends to the regulatory sphere. With cumulative GDPR fines surpassing €7.1 billion by early 2026, the savings from averted penalties are substantial. A single intentional CCPA violation can cost $7,988 per record, which quickly scales into the millions for even a mid-sized database. By utilizing a metrics-based approach, you provide the board with a clear view of how DLP acts as a shield against these escalating financial risks and operational disruptions.
Operational Efficiency: The Hidden ROI of Integrated DLP
While breach prevention dominates the headlines, the operational efficiency gained through architectural synergy often provides the most consistent financial return. By 2026, global spending on information security reached $183.9 billion, yet many organizations still struggle with fragmented stacks that create more work rather than less. Measuring dlp effectiveness and roi requires looking inward at how your data protection tools streamline your entire security ecosystem. When we lower the “noise floor” by filtering out low-fidelity alerts at the source, we don’t just secure data; we reclaim thousands of man-hours for your most expensive technical assets.
Integrated DLP acts as a filter for your SIEM, ensuring that only high-priority, context-rich events are ingested and analyzed. This architectural synergy directly lowers the Total Cost of Ownership (TCO) by reducing data storage fees and processing overhead. Instead of paying to store a mountain of irrelevant logs, you’re investing in actionable intelligence that empowers your team to make faster, more accurate decisions. This shift from volume-based monitoring to value-based analysis is a hallmark of the Expert Architect approach.
Streamlining GRC and Regulatory Reporting
Manual compliance audits are a massive resource sink that can take weeks of preparation. By automating your Governance Risk and Compliance (GRC) reporting, you turn a reactive scramble into a proactive, steady-state process. Real-time visibility provides the data-driven evidence needed for risk management meetings without the need for manual data aggregation. This automation serves as a direct cost-saving measure by reducing the man-hours required for annual audits by up to 40% in some enterprise environments. It ensures your organization remains compliant with UAE PDPL and international standards without draining your operational budget.
DLP as a Force Multiplier for the SOC
Tier 1 analyst fatigue is a primary risk factor in modern security operations. When DLP context enriches EDR and MDR investigations, it provides the “why” behind an alert, not just the “what.” This enrichment reduces the time spent on repetitive policy checks, allowing analysts to focus on complex threat hunting. Strategic alignment ensures that your DLP, Identity and Access Management (IAM), and Cloud Security Posture Management (CSPM) systems speak the same language. This creates a unified defense that scales with your digital transformation goals. To see how these integrations can be tailored to your specific infrastructure, you can schedule a bespoke architectural assessment with our engineering team.
Ultimately, the hidden ROI of DLP lies in its ability to empower human intelligence. By offloading the burden of routine data classification and policy enforcement to machine-driven automation, you allow your people to solve higher-level problems. This intersection of human capability and machine efficiency is what defines a future-proofed enterprise in the 2026 market. It’s not just about stopping leaks; it’s about building a more resilient, efficient, and profitable business engine.
Implementing a Tailored Measurement Strategy with OAD Technologies
Generic templates often provide a false sense of security that crumbles under the weight of a real-world incident. At OAD Technologies, we believe that measuring dlp effectiveness and roi is a continuous journey rather than a static destination. Our “Expert Architect” approach focuses on the entire data protection lifecycle, ensuring that your security posture evolves alongside your digital transformation goals. We don’t just provide software; we build a strategic partnership that validates your technical controls through rigorous engineering standards and visionary problem-solving.
Future-proofing your data strategy is essential as we enter an era of AI-driven threats and shifting global regulations. For instance, with the full enforcement of the EU AI Act beginning on August 2, 2026, your measurement framework must now account for the intersection of AI governance and data privacy. We help you stay ahead of these shifts by integrating machine capability with human intelligence, ensuring that your automated systems empower your team rather than creating new compliance bottlenecks. This proactive stance protects your long-term digital relevance in an increasingly volatile market.
From Generic Templates to Strategic Alignment
Your industry-specific risk profile should dictate your measurement framework. A financial institution facing a $6.08 million average breach cost requires a different set of bespoke KPIs than a healthcare provider protecting $9.80 million in sensitive patient records. We utilize collaborative roadmapping to build a strategy that grows with your organization. This process ensures that your technical security assessments do more than just identify gaps; they provide a clear roadmap for strategic growth. By aligning your technical authority with your business results, we ensure that every security decision is grounded in operational reality and financial precision.
Next Steps: Securing Your Digital Assets
The path to a resilient security architecture begins with a clear understanding of your current state. We recommend starting with a baseline technical assessment to identify existing vulnerabilities and unmanaged “dark data” silos. This assessment provides the data-driven evidence needed to justify future investments and refine your existing policies. Our team works as an extension of your own, ensuring a seamless integration of new strategies into your established workflows. We invite you to move beyond one-size-fits-all solutions and embrace a more sophisticated, tailored approach to data protection.
Mastering the art of data protection requires both technical depth and strategic vision. If you’re ready to transform your security logs into actionable business value, take the first step toward a more resilient future. Request a bespoke DLP strategy consultation with OAD Technologies today to start measuring dlp effectiveness and roi with the precision your enterprise demands.
Securing Your Strategic Growth in the 2026 Data Economy
Data protection in 2026 is no longer a reactive shield; it’s a strategic engine for business resilience. By transitioning from simple incident counting to a rigorous framework involving Annual Loss Expectancy (ALE) and the Data Visibility Index, you’ve laid the groundwork for technical and financial authority. These metrics ensure your security architecture doesn’t just stop leaks but actively contributes to operational efficiency and brand equity. Mastering the art of measuring dlp effectiveness and roi allows your organization to thrive amidst the $10.5 trillion global cybercrime threat landscape while maintaining strict compliance with UAE PDPL and NESA standards.
As a Dubai-based technical authority, OAD Technologies provides the “Expert Architect” perspective needed to bridge the gap between complex software logs and C-suite results. Our deep expertise in MSSP and GRC integration ensures that your data strategy is future-proofed against evolving AI-driven risks. It’s time to move beyond one-size-fits-all security and embrace a roadmap designed for your unique digital footprint. Architect your bespoke DLP framework with OAD Technologies and secure your organization’s long-term digital relevance today.
Frequently Asked Questions
What are the most important KPIs for measuring DLP effectiveness?
The most critical KPIs focus on visibility, accuracy, and response speed. You should track the Data Discovery Success Rate to ensure 100% visibility of sensitive assets and the Policy Accuracy Rate to keep false positives low. Additionally, monitoring the Mean Time to Respond (MTTR) is vital, as it currently takes organizations an average of 277 days to identify and contain a security incident.
How do you calculate the ROI of a Data Loss Prevention solution?
You calculate the Return on Security Investment (ROSI) by comparing the cost of the solution to the potential financial losses avoided. Use the formula: ROSI equals the risk mitigation percentage multiplied by the Annual Loss Expectancy (ALE), minus the solution cost, all divided by the solution cost. This structured approach is essential for measuring dlp effectiveness and roi and justifying your security budget to the board.
Can DLP help with UAE PDPL compliance?
Yes, modern DLP solutions provide the technical evidence required to meet UAE PDPL mandates regarding data residency and protection. By automating data classification and monitoring, you ensure that personal data stays within authorized boundaries. This automation is crucial as regulators increase enforcement, mirroring the trend in Europe where authorities now receive an average of 443 data breach notifications every day.
What is a “good” false positive rate for enterprise DLP?
A high-performing enterprise DLP system should maintain a false positive rate below 5% to avoid draining SOC resources. When rates exceed this threshold, analyst fatigue sets in, and the risk of missing a genuine threat increases significantly. Precision tuning and AI-driven semantic analysis are the best methods for maintaining this balance without sacrificing your overall security posture.
How does DLP integration with SIEM improve ROI?
Integration improves ROI by enriches your SIEM with high-fidelity data, which reduces the “noise floor” and lowers storage costs. This architectural synergy allows your SOC team to focus on actionable intelligence rather than raw logs. By streamlining these workflows, you lower the Total Cost of Ownership (TCO) while increasing the speed of your incident response capabilities.
Is it possible to measure the value of protected intellectual property?
You can measure this value by calculating the potential loss of market share or the cost of R&D reinvestment required if your trade secrets were compromised. With global cybercrime costs projected to hit $10.5 trillion in 2026, protecting proprietary data is a direct contributor to your competitive advantage. Quantifying these intangible assets helps move security from a cost center to a value protector.
How often should we review our DLP metrics and policies?
We recommend a comprehensive review of your DLP metrics every quarter and a policy update every six months. The DLP market is growing at a CAGR of 26.9%, meaning the technology and the threats it faces evolve rapidly. Regular reviews ensure that your bespoke KPIs still align with your current digital architecture and the latest regulatory requirements in the UAE.
What is the difference between direct and indirect ROI in cybersecurity?
Direct ROI involves tangible savings from avoided regulatory fines, such as the €35 million penalties under the EU AI Act, and reduced remediation expenses. Indirect ROI focuses on preserved brand equity and customer trust, which prevents the 3% to 5% customer churn typically seen after a breach. Both are essential components of measuring dlp effectiveness and roi to show the full value of your security architecture.
Disclaimer
Content by OAD Technologies is for general informational purposes only and does not constitute professional or cybersecurity advice. No warranties are made regarding accuracy or completeness; reliance is at your own risk. OAD Technologies shall not be liable for any direct or indirect losses arising from use of this content.